

Bridging the Building Data Divide—How NAU Scaled Smart Campus Intelligence
Every building today is full of data-producing systems. HVAC controllers log temperatures and setpoints. Energy meters track consumption. Access systems record entries and exits. Scheduling platforms manage room reservations. Even older buildings have layers of systems that were added over time, each generating data about how the building operates.
But here's the uncomfortable truth: despite all that spending, most organizations still can't actually manage their building data.
The problem is that data sits locked in separate systems—building automation controllers talking to HVAC equipment, CMMS software tracking work orders, energy meters logging consumption, access control managing doors, and scheduling platforms managing rooms. None of these systems talk to each other. Owners can't see what's actually happening across their buildings, and all those AI use cases the vendors pitched? They're still theoretical.
"We had been struggling mightily with the idea of how to aggregate data from all of the IoT devices across BACnet and other places… and failed at the daunting task of trying to aggregate that data in a way that we could action it," said Steve Burrell, CIO at Northern Arizona University (NAU).
At NexusCon 2025, Burrell shared how NAU broke through that wall. Working with Willow and Mapped, the university built an data layer across 175 buildings that's cutting costs, saving energy, and turning the campus into a living laboratory for students.
NAU hit roadblocks, burned time on dead ends, and had to rebuild parts of the implementation when the first approach didn't scale. But they figured it out, and their experience offers a practical roadmap for other owners facing the same mess.
There's urgency here too. The pressure that's already forcing financial institutions to inventory every connected device and prove they can secure it? That's coming to commercial real estate and higher education. Carbon tracking requirements are getting more detailed. Energy disclosure mandates need granular data that's impossible to produce from siloed systems. Owners who wait for compliance deadlines to force action will end up paying a lot more and moving a lot faster than they'd like.
But owners who start now—who treat building data as infrastructure instead of an afterthought—can get ahead of those requirements while also unlocking operational benefits that pay back the investment.
Why the Ownership Gap Exists
Banking and manufacturing faced this problem first. Regulators decided that if you can't inventory and secure every connected device on your network, you can't prove you're managing risk. Financial institutions now have to demonstrate complete visibility into their IT and OT environments—what's connected, where it is, what data it's touching, and who's responsible for patching it.
Buildings avoided that scrutiny for years. But carbon tracking requirements now demand detailed energy data tied to specific systems and spaces. Cybersecurity standards are expanding beyond IT networks into operational technology. Energy disclosure laws in cities like New York and Boston require granular reporting that's impossible without unified data.
The compliance wave that hit other sectors is coming to buildings. Owners who wait for deadlines will face expensive, rushed implementations. Owners who start now get a longer runway and can unlock operational benefits along the way.
The Turning Point at NAU
Northern Arizona University operates at real scale: 175 buildings across three campuses, over 7 million square feet, 28,000 students, faculty, and staff. The university developed a Sustainable Smart Campus Master Plan aimed at economic and operational efficiency, sustainability, and supporting research innovation.
Universities work well as test cases for these problems. They face the same data silos and integration challenges as commercial developers and institutional owners, but often move faster and are more willing to try emerging approaches.
But despite having talented IT staff and active building science research programs, NAU spent years failing to get IoT data from different buildings to work together. The team could collect data from individual systems, but couldn't make it useful for decision-making or automated operations.
The breakthrough came when Microsoft introduced NAU to Willow and Mapped—two companies that provided the architectural link between disconnected building systems and something you could actually use.
Setbacks & Course Correction—What NAU Learned the Hard Way
NAU's path to unified building data involved a lot of backtracking. Before getting to measurable results, the team hit obstacles that nearly killed the whole initiative.
Data overload hit first. Even with skilled IT staff and building researchers on campus, early attempts to aggregate IoT and BMS data across multiple buildings got overwhelming fast. There was data everywhere, but no coherent way to organize or query it.
The ontology gap turned out to be the core problem. NAU could collect data streams, but couldn't connect them. There was no shared context between systems—no way to say that a temperature sensor in Room 201 related to the VAV box serving that space, which connected to an air handling unit on the roof, which drew power from a specific electrical panel. Without that context, data stayed isolated and useless.
"Data is great, but when you can't actually put the context around it… that's what made Steve's job hard," explained Chris from Willow.
Governance confusion slowed everything across organizational lines. IT and Facilities operated as separate departments with different priorities, budgets, and reporting structures. Decisions that needed coordination between teams took weeks or months instead of days.
Cultural friction showed up when technicians encountered analytics-driven insights. Experienced facilities staff were skeptical of fault detection systems that seemed to second-guess their expertise. New workflows took time to gain trust. This required patient change management—demonstrating value rather than imposing mandates.
Manual pain consumed resources that could have gone toward strategic work. Before automation, onboarding building documentation and architectural drawings meant manually extracting data from PDFs, spreadsheets, and CAD files. Each building burned hundreds of hours.
The turning point came when NAU realized it couldn't solve this alone. The team needed partners who had already built proven ontological frameworks and normalized data models.
Building the Foundation—Converged Data Architecture
Willow and Mapped brought complementary capabilities that addressed NAU's architectural problems.
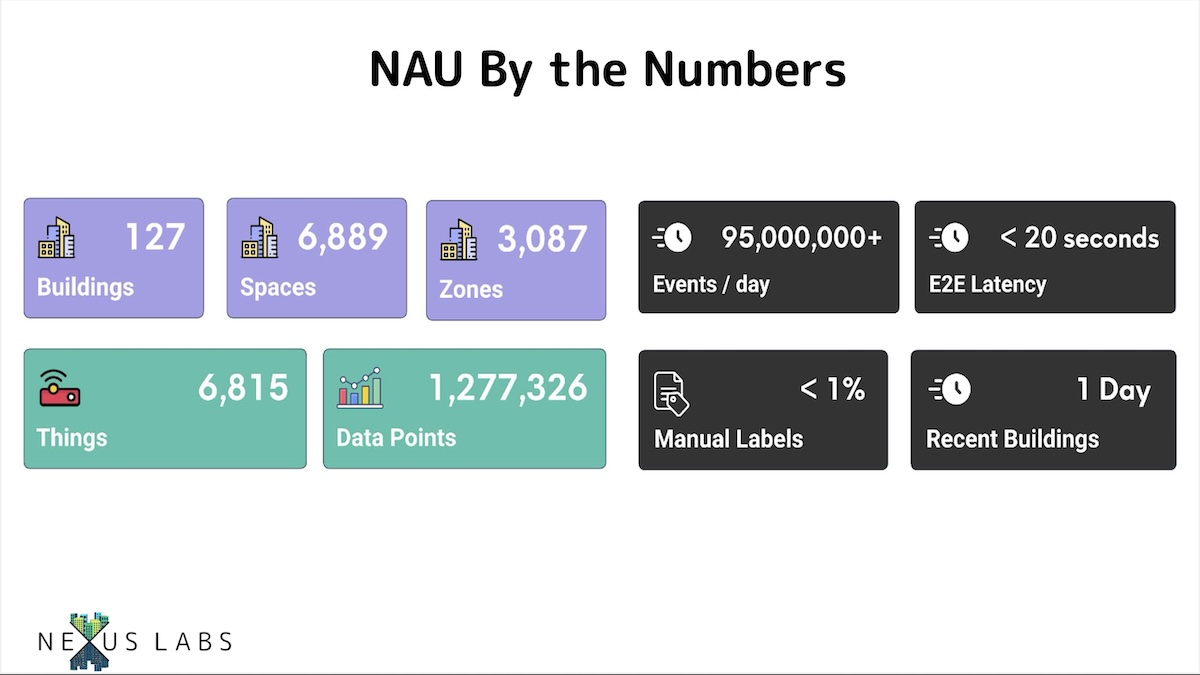
Mapped deployed an independent data layer to normalize and stream data across eight different integrations—building management systems, utility meters, occupancy sensors, room scheduling platforms, and more. The platform uses a single on-site gateway observing roughly 1 million data points across NAU's campus.
Internally, Mapped uses Brick Schema, an open-source ontology for representing building systems and their relationships. But rather than forcing NAU to adopt Brick Schema everywhere, Mapped performs ontological conversion in real time as data moves between systems.
"We're normalizing the data in real time… doing ontological conversion as data gets passed between our two platforms," explained José de Castro, CTO at Mapped.
Willow layered its user-facing software application, knowledge graph, and AI toolset on top of Mapped's normalized data layer. This includes Copilot for natural language queries, anomaly detection for spotting operational issues, and diagnostics that help maintenance teams troubleshoot problems faster.
The architecture follows several key design principles. It treats ontology as infrastructure, not documentation—the data model actively powers queries and controls, rather than sitting as static reference material. And it performs normalization at the edge, so data arrives in Willow's knowledge graph already contextualized and ready to use.
This approach let NAU scale use cases across buildings without rebuilding integration logic for each new system or location.
Data to Action—AI-Powered Operations at NAU
The architectural foundation enabled practical operational improvements with measurable time savings and cost reductions.

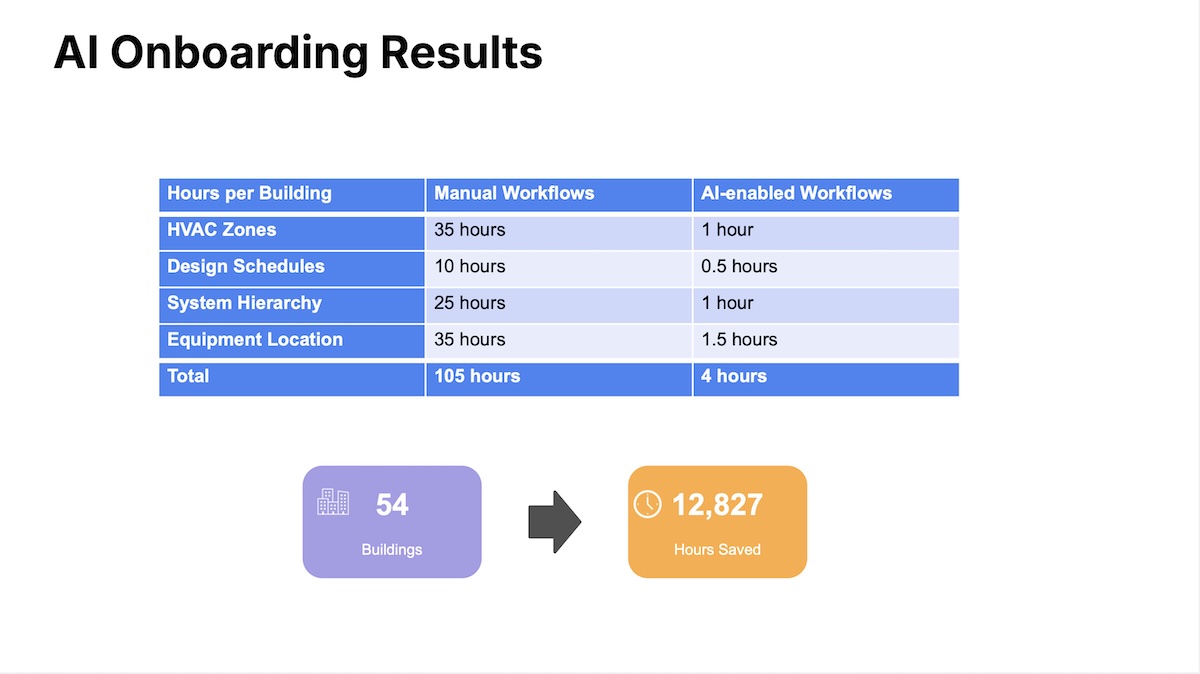
AI-assisted onboarding transformed NAU's ability to bring new buildings into the data layer. Traditional manual workflows required 105 hours per building: 35 hours to map HVAC zones, 10 hours to extract design schedules, 25 hours to build system hierarchies, and another 35 hours to locate equipment and document relationships.
Using Willow's AI onboarding tools, those workflows dropped to 4 hours per building. Generative AI extracts equipment relationships directly from HVAC drawings and populates Willow's knowledge graph with structured data. Across 54 buildings, this saved over 12,800 hours—the equivalent of six full-time employees working for a year.
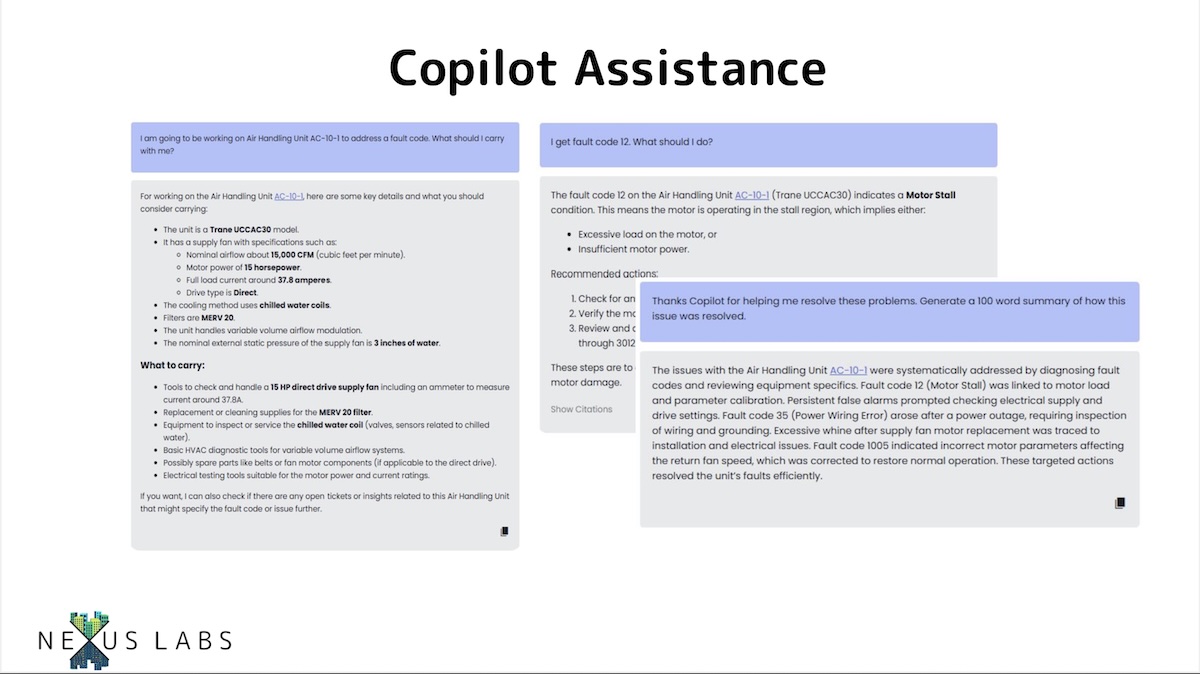
Willow's Copilot integrated with live building systems to provide real-time fault diagnosis and troubleshooting help for maintenance teams. When a technician gets a fault code from an air handling unit, they can ask Copilot what the code means, what tools and parts they'll need, and what steps to take—all grounded in NAU's actual equipment documentation and operational history.
"The younger people we're hiring don't know where the file cabinets are," Burrell explained. "Now, they can use Copilot against our building data to get context instantly."
This addresses a real workforce problem. As experienced technicians retire, institutional knowledge walks out the door. Copilot provides a way to capture and share that knowledge through an interface that newer employees already understand.
From Insight to Impact—Occupancy-Based HVAC Control
The occupancy-based HVAC control use case shows how NAU's data architecture translates directly into operational ROI.
The problem was simple but expensive: classrooms across campus ran in "occupied" mode for 16 hours a day or more, even though many were only used for 6-8 hours of actual instruction. HVAC systems were conditioning empty spaces, wasting energy and driving up utility costs.
The solution required connecting three previously siloed data sources. Crestron occupancy sensors provided real-time detection of whether people were actually in a space. The university's class scheduling system showed when rooms were supposed to be occupied. And the building management system controlled HVAC terminal units that conditioned those spaces.
NAU's ontology-driven architecture made these connections possible. The knowledge graph understood that a specific room was served by a specific VAV box, which was fed by a specific air handling unit. When the scheduling system showed no classes scheduled and the occupancy sensor confirmed the room was empty, the system could automatically adjust setpoints or switch the terminal unit to unoccupied mode.

Early results showed energy savings approaching 30% in certain spaces—a substantial reduction driven entirely by better data connectivity and context.
"It pains me every time I drive by a building and it's unoccupied, and the space is being conditioned," said Rick Sczodronski, Chief Product Officer at Willow.
This use case matters for building owners because it shows that data connectivity and context drive measurable operational ROI. The payback isn't theoretical or years away—it shows up in the next utility bill.
Beyond Operations—Data as a Living Laboratory
NAU's vision for its smart campus infrastructure extends beyond facilities management and energy savings. The university is exposing its building data layer to students and researchers, turning the campus itself into a living laboratory.
Students in building science and sustainability programs can access real-time carbon emissions data tied to specific buildings and systems. They can see how weather, occupancy, and operational decisions affect energy consumption. They can test hypotheses about building performance using actual data from the spaces they walk through every day.
This ties back to the basic question of data ownership. When building data infrastructure is properly governed and accessible, it delivers value far beyond operational efficiency. It becomes a strategic asset supporting institutional goals around education, research, and innovation.
"We recognized and worked with Willow to expose the data in a way that NAU owns it and leverages it—not just for operations, but for research and instruction," Burrell explained.
Proper data governance becomes foundational for sustainability reporting, academic research, and long-term innovation goals. NAU's investment in unified building data pays dividends across multiple stakeholder groups, not just the facilities department.
Lessons for Building Owners
NAU's experience offers practical guidance for building owners and operators considering similar initiatives.
Start with data governance. You can't automate what you can't see, and you can't manage what you don't understand. Before investing in analytics platforms or AI tools, establish clarity on what data exists, where it lives, who owns it, and what quality standards it must meet.
Plan for multiple budget cycles. NAU's smart campus initiative is a 10-year program, not a one-year project. Data cleanup, system integration, and organizational change all take time. Major data hygiene costs—fixing incorrect equipment labels, documenting system relationships, standardizing naming conventions—can't be avoided or rushed.
Bring IT to the table early. Collaboration across departments made NAU's program successful. Facilities teams understand building systems, but IT teams understand data architecture, cybersecurity, and enterprise integration. Both perspectives are essential.
Look for partners who understand ontology and normalization. Data integration isn't a facilities-only job that can be handled by pointing sensors at a dashboard anymore. The technical challenges around semantic modeling, real-time data transformation, and knowledge graph construction require specialized expertise.
Expect compliance to catch up. Financial institutions already have to inventory connected devices and demonstrate cybersecurity controls for operational technology. Commercial real estate, higher education, and healthcare aren't far behind. Starting now provides runway to implement thoughtfully rather than scrambling under regulatory pressure.
The Road Ahead—From Pockets of Innovation to Portfolio Scale
Building owners today are running lots of pilot projects and proof-of-concept deployments, but relatively few have scaled programs delivering operational value across entire portfolios.
NAU represents what's possible when building owners commit to solving the integration problem rather than accumulating more point solutions. The university's approach—starting with data architecture, investing in ontological modeling, and building operational use cases on that foundation—provides a repeatable playbook for other institutional and commercial owners.
The sooner owners begin the difficult work of data cleanup and integration, the longer their runway before compliance mandates and carbon tracking requirements force rushed implementations. Smart buildings aren't about flashy technology demonstrations anymore. They're about building trustworthy data foundations that pay off over time through better operations, lower costs, and the flexibility to adopt new capabilities as they mature.
NAU figured out what most owners are still struggling with: you can't run AI on top of a mess. Fix the data architecture first, and the rest gets a lot easier.
Every building today is full of data-producing systems. HVAC controllers log temperatures and setpoints. Energy meters track consumption. Access systems record entries and exits. Scheduling platforms manage room reservations. Even older buildings have layers of systems that were added over time, each generating data about how the building operates.
But here's the uncomfortable truth: despite all that spending, most organizations still can't actually manage their building data.
The problem is that data sits locked in separate systems—building automation controllers talking to HVAC equipment, CMMS software tracking work orders, energy meters logging consumption, access control managing doors, and scheduling platforms managing rooms. None of these systems talk to each other. Owners can't see what's actually happening across their buildings, and all those AI use cases the vendors pitched? They're still theoretical.
"We had been struggling mightily with the idea of how to aggregate data from all of the IoT devices across BACnet and other places… and failed at the daunting task of trying to aggregate that data in a way that we could action it," said Steve Burrell, CIO at Northern Arizona University (NAU).
At NexusCon 2025, Burrell shared how NAU broke through that wall. Working with Willow and Mapped, the university built an data layer across 175 buildings that's cutting costs, saving energy, and turning the campus into a living laboratory for students.
NAU hit roadblocks, burned time on dead ends, and had to rebuild parts of the implementation when the first approach didn't scale. But they figured it out, and their experience offers a practical roadmap for other owners facing the same mess.
There's urgency here too. The pressure that's already forcing financial institutions to inventory every connected device and prove they can secure it? That's coming to commercial real estate and higher education. Carbon tracking requirements are getting more detailed. Energy disclosure mandates need granular data that's impossible to produce from siloed systems. Owners who wait for compliance deadlines to force action will end up paying a lot more and moving a lot faster than they'd like.
But owners who start now—who treat building data as infrastructure instead of an afterthought—can get ahead of those requirements while also unlocking operational benefits that pay back the investment.
Why the Ownership Gap Exists
Banking and manufacturing faced this problem first. Regulators decided that if you can't inventory and secure every connected device on your network, you can't prove you're managing risk. Financial institutions now have to demonstrate complete visibility into their IT and OT environments—what's connected, where it is, what data it's touching, and who's responsible for patching it.
Buildings avoided that scrutiny for years. But carbon tracking requirements now demand detailed energy data tied to specific systems and spaces. Cybersecurity standards are expanding beyond IT networks into operational technology. Energy disclosure laws in cities like New York and Boston require granular reporting that's impossible without unified data.
The compliance wave that hit other sectors is coming to buildings. Owners who wait for deadlines will face expensive, rushed implementations. Owners who start now get a longer runway and can unlock operational benefits along the way.
The Turning Point at NAU
Northern Arizona University operates at real scale: 175 buildings across three campuses, over 7 million square feet, 28,000 students, faculty, and staff. The university developed a Sustainable Smart Campus Master Plan aimed at economic and operational efficiency, sustainability, and supporting research innovation.
Universities work well as test cases for these problems. They face the same data silos and integration challenges as commercial developers and institutional owners, but often move faster and are more willing to try emerging approaches.
But despite having talented IT staff and active building science research programs, NAU spent years failing to get IoT data from different buildings to work together. The team could collect data from individual systems, but couldn't make it useful for decision-making or automated operations.
The breakthrough came when Microsoft introduced NAU to Willow and Mapped—two companies that provided the architectural link between disconnected building systems and something you could actually use.
Setbacks & Course Correction—What NAU Learned the Hard Way
NAU's path to unified building data involved a lot of backtracking. Before getting to measurable results, the team hit obstacles that nearly killed the whole initiative.
Data overload hit first. Even with skilled IT staff and building researchers on campus, early attempts to aggregate IoT and BMS data across multiple buildings got overwhelming fast. There was data everywhere, but no coherent way to organize or query it.
The ontology gap turned out to be the core problem. NAU could collect data streams, but couldn't connect them. There was no shared context between systems—no way to say that a temperature sensor in Room 201 related to the VAV box serving that space, which connected to an air handling unit on the roof, which drew power from a specific electrical panel. Without that context, data stayed isolated and useless.
"Data is great, but when you can't actually put the context around it… that's what made Steve's job hard," explained Chris from Willow.
Governance confusion slowed everything across organizational lines. IT and Facilities operated as separate departments with different priorities, budgets, and reporting structures. Decisions that needed coordination between teams took weeks or months instead of days.
Cultural friction showed up when technicians encountered analytics-driven insights. Experienced facilities staff were skeptical of fault detection systems that seemed to second-guess their expertise. New workflows took time to gain trust. This required patient change management—demonstrating value rather than imposing mandates.
Manual pain consumed resources that could have gone toward strategic work. Before automation, onboarding building documentation and architectural drawings meant manually extracting data from PDFs, spreadsheets, and CAD files. Each building burned hundreds of hours.
The turning point came when NAU realized it couldn't solve this alone. The team needed partners who had already built proven ontological frameworks and normalized data models.
Building the Foundation—Converged Data Architecture
Willow and Mapped brought complementary capabilities that addressed NAU's architectural problems.
Mapped deployed an independent data layer to normalize and stream data across eight different integrations—building management systems, utility meters, occupancy sensors, room scheduling platforms, and more. The platform uses a single on-site gateway observing roughly 1 million data points across NAU's campus.
Internally, Mapped uses Brick Schema, an open-source ontology for representing building systems and their relationships. But rather than forcing NAU to adopt Brick Schema everywhere, Mapped performs ontological conversion in real time as data moves between systems.
"We're normalizing the data in real time… doing ontological conversion as data gets passed between our two platforms," explained José de Castro, CTO at Mapped.
Willow layered its user-facing software application, knowledge graph, and AI toolset on top of Mapped's normalized data layer. This includes Copilot for natural language queries, anomaly detection for spotting operational issues, and diagnostics that help maintenance teams troubleshoot problems faster.
The architecture follows several key design principles. It treats ontology as infrastructure, not documentation—the data model actively powers queries and controls, rather than sitting as static reference material. And it performs normalization at the edge, so data arrives in Willow's knowledge graph already contextualized and ready to use.
This approach let NAU scale use cases across buildings without rebuilding integration logic for each new system or location.
Data to Action—AI-Powered Operations at NAU
The architectural foundation enabled practical operational improvements with measurable time savings and cost reductions.
AI-assisted onboarding transformed NAU's ability to bring new buildings into the data layer. Traditional manual workflows required 105 hours per building: 35 hours to map HVAC zones, 10 hours to extract design schedules, 25 hours to build system hierarchies, and another 35 hours to locate equipment and document relationships.
Using Willow's AI onboarding tools, those workflows dropped to 4 hours per building. Generative AI extracts equipment relationships directly from HVAC drawings and populates Willow's knowledge graph with structured data. Across 54 buildings, this saved over 12,800 hours—the equivalent of six full-time employees working for a year.
Willow's Copilot integrated with live building systems to provide real-time fault diagnosis and troubleshooting help for maintenance teams. When a technician gets a fault code from an air handling unit, they can ask Copilot what the code means, what tools and parts they'll need, and what steps to take—all grounded in NAU's actual equipment documentation and operational history.
"The younger people we're hiring don't know where the file cabinets are," Burrell explained. "Now, they can use Copilot against our building data to get context instantly."
This addresses a real workforce problem. As experienced technicians retire, institutional knowledge walks out the door. Copilot provides a way to capture and share that knowledge through an interface that newer employees already understand.
From Insight to Impact—Occupancy-Based HVAC Control
The occupancy-based HVAC control use case shows how NAU's data architecture translates directly into operational ROI.
The problem was simple but expensive: classrooms across campus ran in "occupied" mode for 16 hours a day or more, even though many were only used for 6-8 hours of actual instruction. HVAC systems were conditioning empty spaces, wasting energy and driving up utility costs.
The solution required connecting three previously siloed data sources. Crestron occupancy sensors provided real-time detection of whether people were actually in a space. The university's class scheduling system showed when rooms were supposed to be occupied. And the building management system controlled HVAC terminal units that conditioned those spaces.
NAU's ontology-driven architecture made these connections possible. The knowledge graph understood that a specific room was served by a specific VAV box, which was fed by a specific air handling unit. When the scheduling system showed no classes scheduled and the occupancy sensor confirmed the room was empty, the system could automatically adjust setpoints or switch the terminal unit to unoccupied mode.
Early results showed energy savings approaching 30% in certain spaces—a substantial reduction driven entirely by better data connectivity and context.
"It pains me every time I drive by a building and it's unoccupied, and the space is being conditioned," said Rick Sczodronski, Chief Product Officer at Willow.
This use case matters for building owners because it shows that data connectivity and context drive measurable operational ROI. The payback isn't theoretical or years away—it shows up in the next utility bill.
Beyond Operations—Data as a Living Laboratory
NAU's vision for its smart campus infrastructure extends beyond facilities management and energy savings. The university is exposing its building data layer to students and researchers, turning the campus itself into a living laboratory.
Students in building science and sustainability programs can access real-time carbon emissions data tied to specific buildings and systems. They can see how weather, occupancy, and operational decisions affect energy consumption. They can test hypotheses about building performance using actual data from the spaces they walk through every day.
This ties back to the basic question of data ownership. When building data infrastructure is properly governed and accessible, it delivers value far beyond operational efficiency. It becomes a strategic asset supporting institutional goals around education, research, and innovation.
"We recognized and worked with Willow to expose the data in a way that NAU owns it and leverages it—not just for operations, but for research and instruction," Burrell explained.
Proper data governance becomes foundational for sustainability reporting, academic research, and long-term innovation goals. NAU's investment in unified building data pays dividends across multiple stakeholder groups, not just the facilities department.
Lessons for Building Owners
NAU's experience offers practical guidance for building owners and operators considering similar initiatives.
Start with data governance. You can't automate what you can't see, and you can't manage what you don't understand. Before investing in analytics platforms or AI tools, establish clarity on what data exists, where it lives, who owns it, and what quality standards it must meet.
Plan for multiple budget cycles. NAU's smart campus initiative is a 10-year program, not a one-year project. Data cleanup, system integration, and organizational change all take time. Major data hygiene costs—fixing incorrect equipment labels, documenting system relationships, standardizing naming conventions—can't be avoided or rushed.
Bring IT to the table early. Collaboration across departments made NAU's program successful. Facilities teams understand building systems, but IT teams understand data architecture, cybersecurity, and enterprise integration. Both perspectives are essential.
Look for partners who understand ontology and normalization. Data integration isn't a facilities-only job that can be handled by pointing sensors at a dashboard anymore. The technical challenges around semantic modeling, real-time data transformation, and knowledge graph construction require specialized expertise.
Expect compliance to catch up. Financial institutions already have to inventory connected devices and demonstrate cybersecurity controls for operational technology. Commercial real estate, higher education, and healthcare aren't far behind. Starting now provides runway to implement thoughtfully rather than scrambling under regulatory pressure.
The Road Ahead—From Pockets of Innovation to Portfolio Scale
Building owners today are running lots of pilot projects and proof-of-concept deployments, but relatively few have scaled programs delivering operational value across entire portfolios.
NAU represents what's possible when building owners commit to solving the integration problem rather than accumulating more point solutions. The university's approach—starting with data architecture, investing in ontological modeling, and building operational use cases on that foundation—provides a repeatable playbook for other institutional and commercial owners.
The sooner owners begin the difficult work of data cleanup and integration, the longer their runway before compliance mandates and carbon tracking requirements force rushed implementations. Smart buildings aren't about flashy technology demonstrations anymore. They're about building trustworthy data foundations that pay off over time through better operations, lower costs, and the flexibility to adopt new capabilities as they mature.
NAU figured out what most owners are still struggling with: you can't run AI on top of a mess. Fix the data architecture first, and the rest gets a lot easier.


This is a great piece!
I agree.