

What's Worth Doing? A Practical Guide to Prioritizing Smart Building Energy ROI
You bought the smart thermostats. The BAS integration went live last year. The occupancy sensors are up and running. Your facility team says things are better. The vendors send you reports every month with charts that look impressive.
But can you prove any of it is actually working?
Not just dashboards and projections. Actual, measurable impact that you can stand behind when your CFO asks what you've accomplished with the budget they approved 18 months ago.
The gap between what gets installed and what gets measured is where most energy efficiency projects die. Not because the technology doesn't work, but because nobody set up a system to track whether it's delivering value. And without that proof, the next round of funding becomes a much harder conversation.
At a recent NexusCon presentation, Owen Dalton, Smart Buildings Leader at The Clarient Group, walked through a structured framework his firm uses with building owners to cut through the noise. The approach addresses something many owners struggle with: how to move beyond the pilot phase and figure out which energy use cases actually move the needle.
The goal is simple—being honest about what's working and what isn't, then using that clarity to prioritize the work that delivers real, measurable returns. The good news: there are proven approaches that work. The reality: getting there requires admitting when pilots fail and sometimes killing projects that looked great in the proposal.
The Problem: Energy Data Without Direction
Fragmented pilots stay isolated. The HVAC optimization and the lighting project are currently not integrated. The occupancy analytics sit in a different platform than your building management system. The cumulative energy savings you expected never materialize because nothing is working together.
"As much emotional energy as you've put into wanting this thing to succeed, you need to be honest with what's working and what's not," Dalton said.
The question: How do you take scattered initiatives and turn them into a program that executives will keep funding?
The Framework: From Scattered Pilots to Measurable Action
Clarient Group’s approach is straightforward. Map what you actually have—not what the proposals promised, but what's really installed and running. Then categorize those efforts by the problems they're supposed to solve.
"Start to genericize the solution—talk about categories and problems being solved, not vendors," Dalton explained.

The framework breaks down into a structured process:
Map your existing landscape. List every pilot, every integration, every smart building initiative currently running in your portfolio. Include the systems that were supposed to integrate but never quite got there. Be complete and be honest.
Define use cases clearly. Group your initiatives by the energy problems they address—HVAC optimization, lighting controls, plug load management, occupancy-based scheduling, equipment fault detection. Strip away the marketing language and focus on what each system is actually supposed to do.
Prioritize based on two factors. First, desirability—does this use case reduce real friction and solve actual problems? Second, feasibility—do you have the systems and data to execute it today?
Step One: Evaluate Use Cases by Desirability and Feasibility
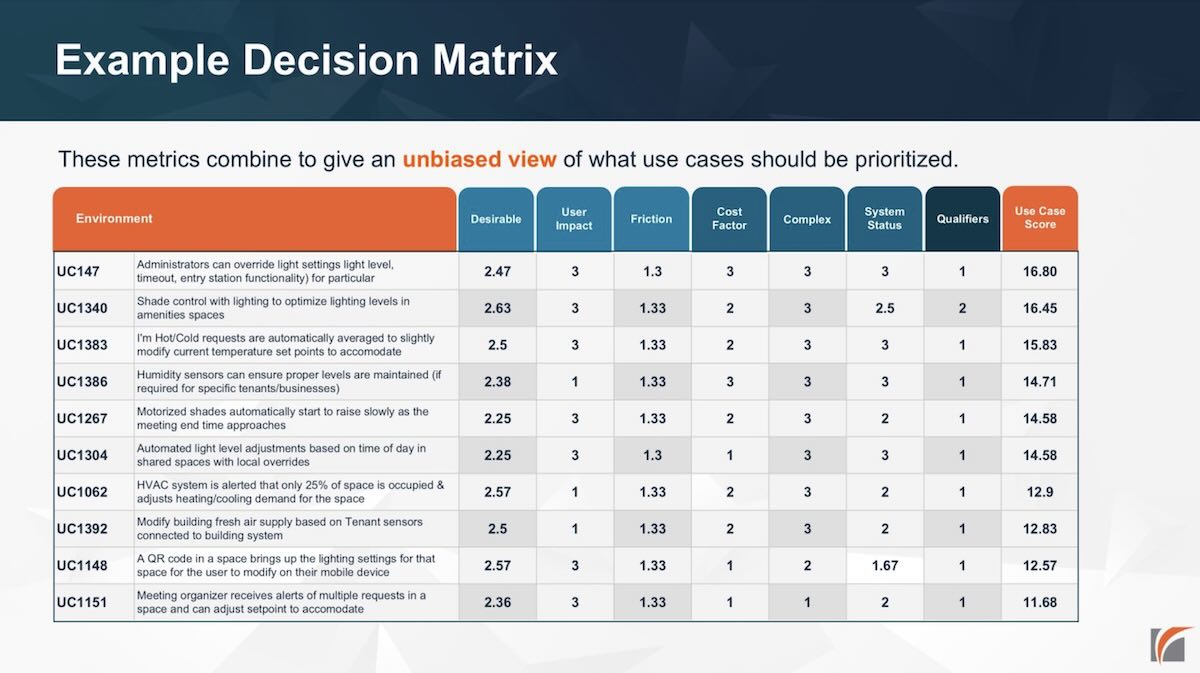
Clarient Group uses a decision matrix that scores each potential use case against two dimensions:
Desirability: Does this use case solve a problem that actually costs you money, wastes energy, or creates operational headaches?
Feasibility: Can your building automation system talk to your occupancy sensors? Is the data clean enough to trust? Or will you need six months of integration work before you can start?
Take occupancy-driven HVAC control as an example. The desirability is usually high—most buildings heat and cool spaces when nobody's there, which is pure waste. But feasibility varies wildly. If you have occupancy sensors already installed and a BAS that can accept external inputs, feasibility is high. If your HVAC zones don't align with where your sensors are placed, or if your BAS is so old it can't be programmed without vendor support, feasibility drops.
Research backs this up. Studies of commercial buildings have found that occupancy-based scheduling can reduce HVAC energy consumption, with one analysis of over 432 buildings finding median energy savings of 2.1% from HVAC rescheduling alone. But those savings only materialize when the systems can actually communicate and when zones align with occupancy patterns.
Then there's the human factor. Dalton opened his talk by referencing an example from the session before his—a county that mandated specific types of lighting switches because the existing smart controls were so confusing that people couldn't figure out how to turn the lights on. You can have the most sophisticated adaptive lighting system in the world, but if users can't operate it, you've wasted money on energy technology that frustrates people.
Step Two: Quantify ROI—Tangible vs. Intangible Savings
Once you've identified which use cases are desirable and feasible, you need to figure out which ones deliver returns. Not all savings show up on your energy bill.
Clarient Group breaks benefits into two categories:
Tangible benefits are the easy ones. Reduced kilowatt-hours. Lower demand charges. Decreased runtime on equipment. These show up in utility bills and maintenance logs. You can measure them, track them month over month, and calculate payback periods with reasonable confidence.
Intangible benefits are harder but often more valuable. Improved occupant comfort. Better operational efficiency. Enhanced ability to make decisions based on real data instead of guesses. These matter—sometimes more than energy savings—but they're difficult to quantify in an ROI calculation.

The framework acknowledges both. As Dalton put it: "Benefits are harder to realize and make part of the calculation—but you need both the tangible and intangible."
This is where the 3-30-300 framework from JLL becomes relevant. For each square foot of space, organizations typically spend $3 on utilities, $30 on rent, and $300 on payroll. A measure that saves 10% on utilities saves you $0.30 per square foot. A measure that improves productivity by just 1% saves you $3 per square foot—ten times more.
This doesn't mean you should ignore energy savings. It means you should prioritize use cases that deliver both. Smart HVAC scheduling reduces runtime hours (tangible) while maintaining occupant comfort (intangible).
Step Three: Prioritize by Payback Timeline
Having quantified your benefits, the next step is prioritizing based on how quickly you can realize them. An energy project that pays back in 18 months is very different from one that takes five years.
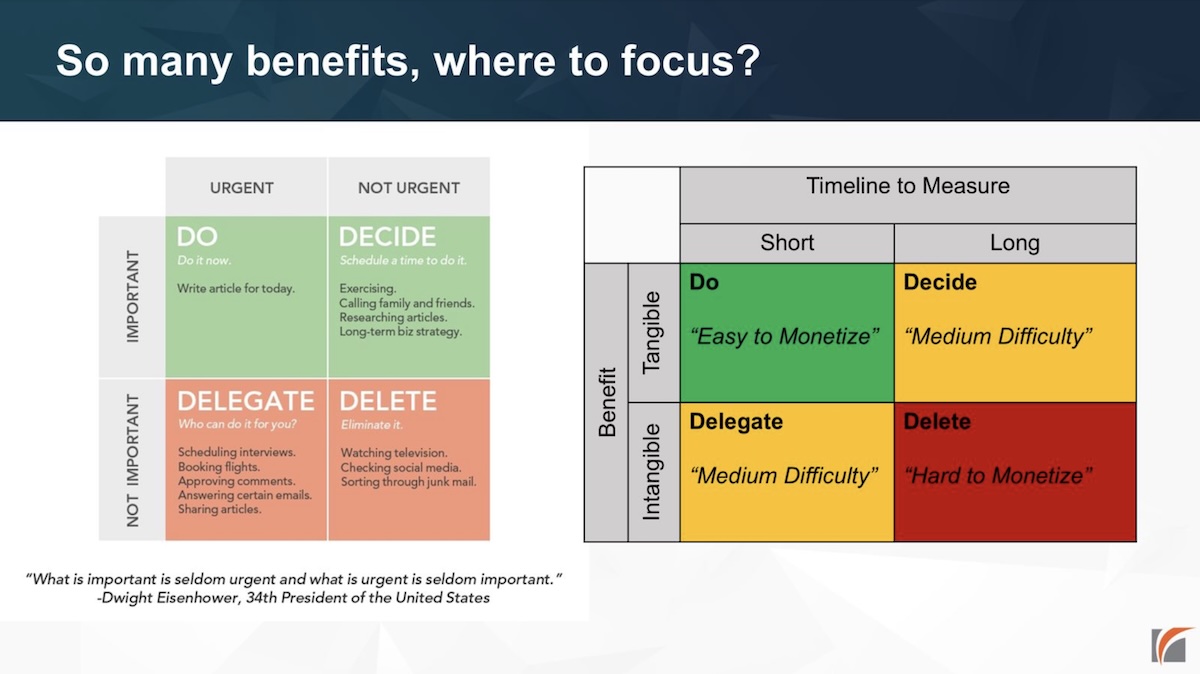
Clarient Group uses an ROI matrix that plots use cases based on two factors: how tangible the benefits are and how quickly you can measure them.
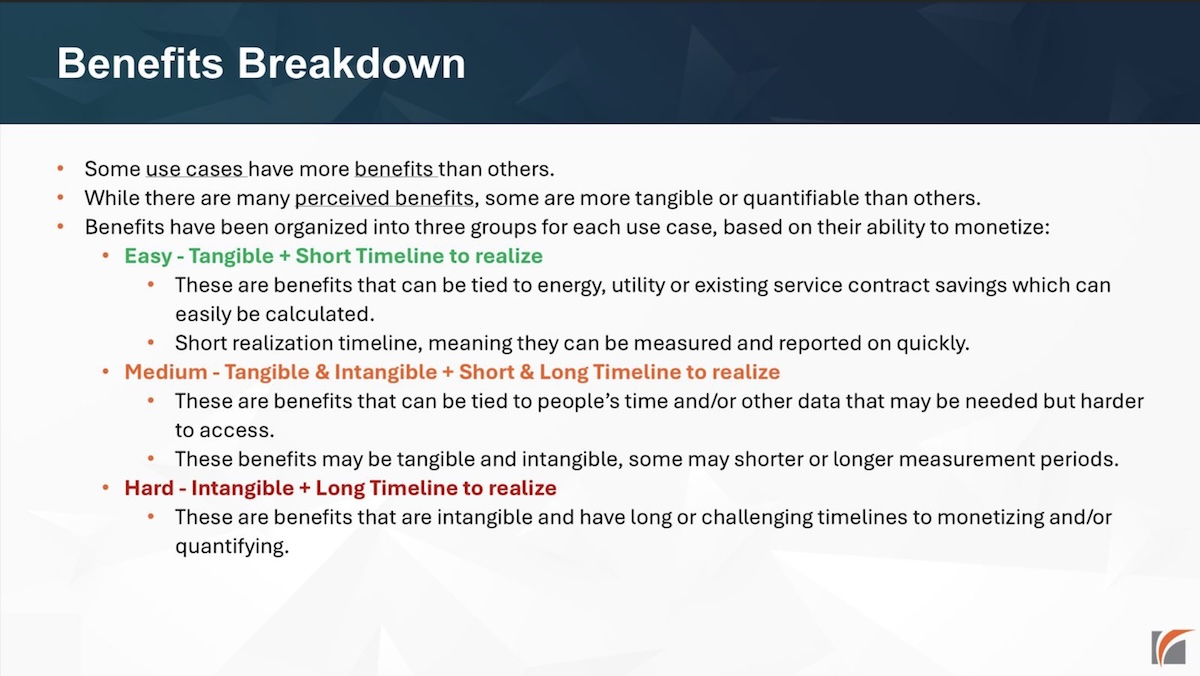
Easy to monetize: Benefits tied to energy, utility, or service contract savings. Example: adjusting cleaning schedules based on occupancy data delivers immediate savings from reduced service hours.
Medium difficulty: Benefits tied to time savings or data that requires work to access. Example: using fault detection to reduce work order tickets requires tracking volumes and resolution times.
Hard to monetize: Intangible benefits with long timelines. Example: improved occupant satisfaction from better HVAC control. Research shows occupancy-based HVAC control can achieve 17-24% energy savings while maintaining comfort, but measuring satisfaction takes time.
The matrix forces you to start with what you can prove today:
Short-term: Adjust cleaning schedules using occupancy data for immediate operational savings.
Medium-term: Optimize HVAC scheduling with occupancy sensors and BAS integration for annualized energy cost reduction.
Long-term: Integrate mobile credentials with building access control to enable automation of lighting, HVAC, and equipment based on building access patterns.
Short-term wins fund the long-term roadmap by proving you can execute and measure results.
Step Four: Test, Measure, Adapt
The framework is iterative. Test use cases, measure what happens, and adapt based on what the data tells you.
"Test in the desert and keep the feedback flowing," Dalton said.
Not every project works as intended. Sometimes the sensors aren't accurate enough. Sometimes the integration is more complicated than expected. Sometimes user behavior doesn't match your assumptions. Catch these issues early and adapt.
Research on occupancy-based HVAC controls has found that sensor accuracy directly impacts both energy savings and thermal comfort. If your occupancy sensors report a space as occupied when it's not, your HVAC system will make the wrong decisions.
Each project should feed data back into the system to refine what you do next. If a pilot in Building A delivers better results than Building B, figure out why. Use that information to improve the next rollout.
Lessons Learned: Honest Data Beats Optimistic Promises
Dalton kept coming back to the importance of "reading the sands"—being honest about what's actually happening, and a subtle reference to the conference’s Dune theme.
"Be open and honest—read the sands. Feedback from users, sites, and raw data tells you where the value is," he said.
The culture shift from exploring new possibilities to measuring real performance is hard. Solutions promise results. Projections look optimistic. Your executive team wants to hear that the investment is paying off. But if the data doesn't support it, you need to say so.
The owners who succeed at energy management create a culture where it's okay to report problems early. They track what's working and what isn't. They kill projects that aren't delivering value. And they double down on the initiatives that prove themselves with data.
This builds trust with executives. When you're honest about what's not working, they're more likely to support future proposals based on reported successes.
Making It Work: Tools for Prioritization
Clarient Group uses specific tools to help owners prioritize and track progress:
Early-stage decision matrix: Evaluate use cases against criteria like desirability, user impact, friction reduction, cost, complexity, and system readiness.
ROI framework combined with Eisenhower matrix: Overlay benefit timeline (short vs. long) with benefit type (tangible vs. intangible) to create a priority grid.
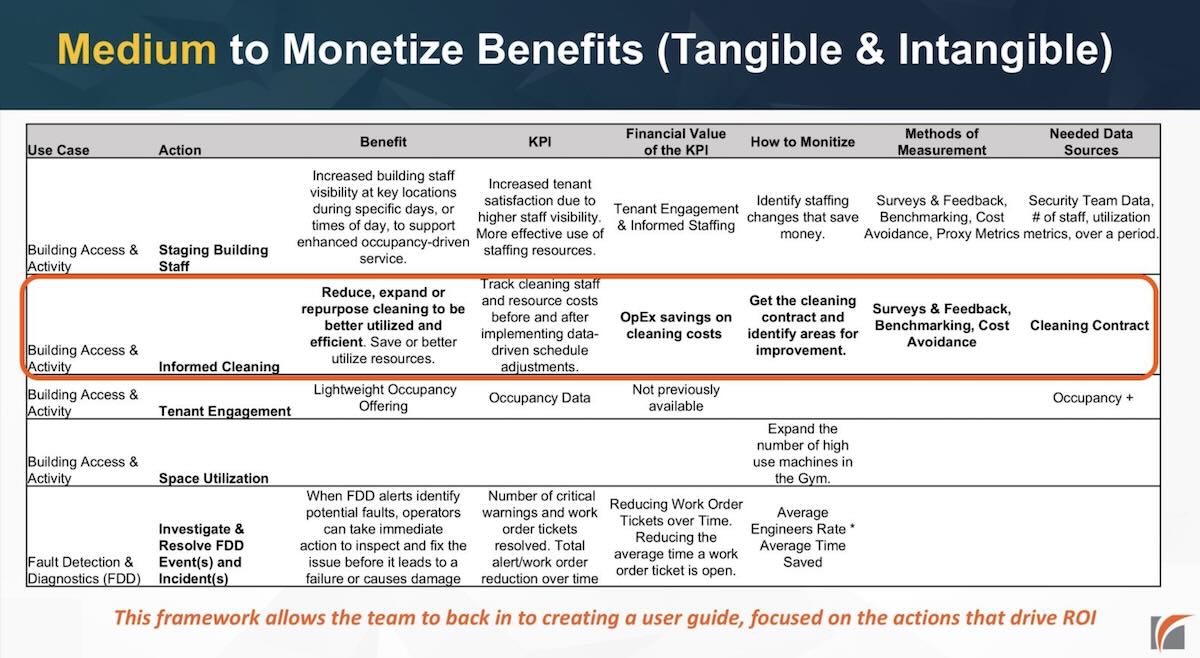
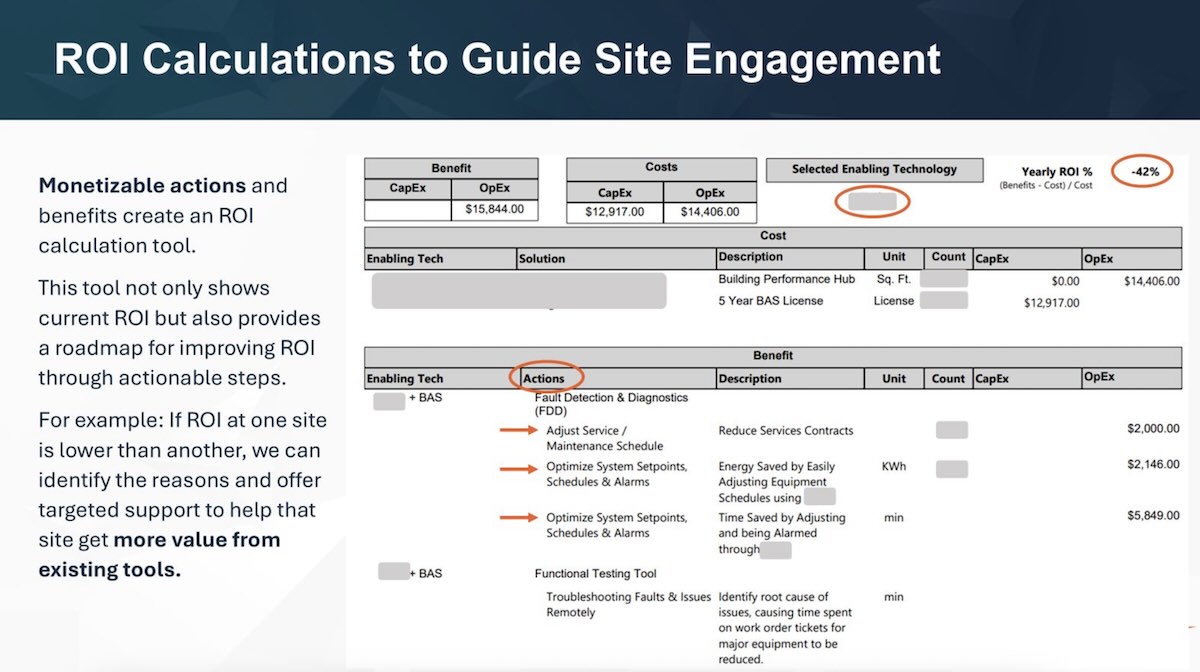
Monetizable actions tracker: Build a detailed breakdown showing the specific action, the KPI you'll track, how you'll measure it, and what data sources you need.
This level of detail makes it possible to calculate ROI rather than estimate it.
From Framework to Practice: The Occupancy-Driven Cleaning Example
To see how this works in practice, consider one use case Clarient Group prioritized: using occupancy data to optimize cleaning contracts.
The problem was clear. Commercial buildings typically clean all spaces on fixed schedules—daily, or every other day, or weekly. But occupancy varies dramatically by space and by time. Conference rooms might be heavily used on Tuesdays and Wednesdays but empty the rest of the week. Offices for staff who work remotely most of the time sit unoccupied. Break rooms in one wing see steady traffic while break rooms in another wing barely get used.
Cleaning on a fixed schedule means you're paying to clean spaces that don't need it while potentially under-cleaning the spaces that do.
The use case: integrate occupancy sensor data with cleaning operations. Identify spaces with consistently low utilization and reduce cleaning frequency. Redirect those cleaning hours to high-traffic areas that need more attention.
The benefits breakdown:
Tangible: Reduced service contract costs. OpEx savings from cleaning less frequently in low-use areas. These are quantifiable—compare your contract costs before and after adjusting schedules.
Intangible (but measurable): Improved cleanliness in high-traffic areas because you've redirected resources. Better space utilization data that helps with future decisions about which spaces to keep and which to repurpose.
Timeline: Short. You can pull your current cleaning contract, overlay occupancy data for the past few months, propose schedule changes, and measure cost impacts within a quarter.
The data sources required: occupancy sensors (which Clarient Group’s client already had from previous pilots), cleaning contracts (readily available), and feedback mechanisms to catch any complaints about cleanliness (survey tenants or track facility tickets).
The ROI calculation: straightforward. If you're spending $50,000 annually on cleaning and you reduce frequency in 20% of your spaces, you save $10,000 per year. If your occupancy sensors are already installed, the cost to implement this change is primarily staff time to analyze the data and renegotiate contracts.
This wasn't the use case anyone expected to prioritize. It wasn't about advanced HVAC optimization or predictive maintenance. But it delivered measurable results quickly, which built confidence in the broader program. And that confidence led to funding for more complex use cases down the line.
Conclusion: Building the Owner's Path to High-ROI Energy Management
The smartest buildings are the ones where energy data turns into action—where pilots become programs, where use cases get measured honestly, and where ROI gets proven rather than promised.
Clarient Group's framework provides a repeatable playbook:
Define your energy use cases by stripping away marketing language. Evaluate desirability and feasibility against your actual systems. Quantify both tangible and intangible ROI. Prioritize by payback timeline. Measure continuously and adapt.
Building Owner Takeaway
Stop collecting pilots, start building programs. Map isolated initiatives against common use cases. Create a program guide that explains how the pieces fit together.
Prioritize what you can measure today. Start with use cases where you have enough information to calculate savings and prove impact.
Create a culture of honest feedback. Make it safe for facility teams to report when things aren't working. The projects you kill based on real data are just as valuable as the ones you scale.
Think beyond energy bills. The 3-30-300 rule reminds us that utilities are the smallest cost in most buildings. Prioritize use cases that save energy while improving operations or occupant experience.
Use simple tools to drive decisions. A decision matrix and an ROI framework—even in a spreadsheet—can organize your thinking and help you focus resources on what matters.
As Dalton put it: "The point isn't a perfect calc—it's keeping your light green."
That means delivering enough measurable results to maintain executive support while building toward more ambitious goals.
You bought the smart thermostats. The BAS integration went live last year. The occupancy sensors are up and running. Your facility team says things are better. The vendors send you reports every month with charts that look impressive.
But can you prove any of it is actually working?
Not just dashboards and projections. Actual, measurable impact that you can stand behind when your CFO asks what you've accomplished with the budget they approved 18 months ago.
The gap between what gets installed and what gets measured is where most energy efficiency projects die. Not because the technology doesn't work, but because nobody set up a system to track whether it's delivering value. And without that proof, the next round of funding becomes a much harder conversation.
At a recent NexusCon presentation, Owen Dalton, Smart Buildings Leader at The Clarient Group, walked through a structured framework his firm uses with building owners to cut through the noise. The approach addresses something many owners struggle with: how to move beyond the pilot phase and figure out which energy use cases actually move the needle.
The goal is simple—being honest about what's working and what isn't, then using that clarity to prioritize the work that delivers real, measurable returns. The good news: there are proven approaches that work. The reality: getting there requires admitting when pilots fail and sometimes killing projects that looked great in the proposal.
The Problem: Energy Data Without Direction
Fragmented pilots stay isolated. The HVAC optimization and the lighting project are currently not integrated. The occupancy analytics sit in a different platform than your building management system. The cumulative energy savings you expected never materialize because nothing is working together.
"As much emotional energy as you've put into wanting this thing to succeed, you need to be honest with what's working and what's not," Dalton said.
The question: How do you take scattered initiatives and turn them into a program that executives will keep funding?
The Framework: From Scattered Pilots to Measurable Action
Clarient Group’s approach is straightforward. Map what you actually have—not what the proposals promised, but what's really installed and running. Then categorize those efforts by the problems they're supposed to solve.
"Start to genericize the solution—talk about categories and problems being solved, not vendors," Dalton explained.
The framework breaks down into a structured process:
Map your existing landscape. List every pilot, every integration, every smart building initiative currently running in your portfolio. Include the systems that were supposed to integrate but never quite got there. Be complete and be honest.
Define use cases clearly. Group your initiatives by the energy problems they address—HVAC optimization, lighting controls, plug load management, occupancy-based scheduling, equipment fault detection. Strip away the marketing language and focus on what each system is actually supposed to do.
Prioritize based on two factors. First, desirability—does this use case reduce real friction and solve actual problems? Second, feasibility—do you have the systems and data to execute it today?
Step One: Evaluate Use Cases by Desirability and Feasibility
Clarient Group uses a decision matrix that scores each potential use case against two dimensions:
Desirability: Does this use case solve a problem that actually costs you money, wastes energy, or creates operational headaches?
Feasibility: Can your building automation system talk to your occupancy sensors? Is the data clean enough to trust? Or will you need six months of integration work before you can start?
Take occupancy-driven HVAC control as an example. The desirability is usually high—most buildings heat and cool spaces when nobody's there, which is pure waste. But feasibility varies wildly. If you have occupancy sensors already installed and a BAS that can accept external inputs, feasibility is high. If your HVAC zones don't align with where your sensors are placed, or if your BAS is so old it can't be programmed without vendor support, feasibility drops.
Research backs this up. Studies of commercial buildings have found that occupancy-based scheduling can reduce HVAC energy consumption, with one analysis of over 432 buildings finding median energy savings of 2.1% from HVAC rescheduling alone. But those savings only materialize when the systems can actually communicate and when zones align with occupancy patterns.
Then there's the human factor. Dalton opened his talk by referencing an example from the session before his—a county that mandated specific types of lighting switches because the existing smart controls were so confusing that people couldn't figure out how to turn the lights on. You can have the most sophisticated adaptive lighting system in the world, but if users can't operate it, you've wasted money on energy technology that frustrates people.
Step Two: Quantify ROI—Tangible vs. Intangible Savings
Once you've identified which use cases are desirable and feasible, you need to figure out which ones deliver returns. Not all savings show up on your energy bill.
Clarient Group breaks benefits into two categories:
Tangible benefits are the easy ones. Reduced kilowatt-hours. Lower demand charges. Decreased runtime on equipment. These show up in utility bills and maintenance logs. You can measure them, track them month over month, and calculate payback periods with reasonable confidence.
Intangible benefits are harder but often more valuable. Improved occupant comfort. Better operational efficiency. Enhanced ability to make decisions based on real data instead of guesses. These matter—sometimes more than energy savings—but they're difficult to quantify in an ROI calculation.
The framework acknowledges both. As Dalton put it: "Benefits are harder to realize and make part of the calculation—but you need both the tangible and intangible."
This is where the 3-30-300 framework from JLL becomes relevant. For each square foot of space, organizations typically spend $3 on utilities, $30 on rent, and $300 on payroll. A measure that saves 10% on utilities saves you $0.30 per square foot. A measure that improves productivity by just 1% saves you $3 per square foot—ten times more.
This doesn't mean you should ignore energy savings. It means you should prioritize use cases that deliver both. Smart HVAC scheduling reduces runtime hours (tangible) while maintaining occupant comfort (intangible).
Step Three: Prioritize by Payback Timeline
Having quantified your benefits, the next step is prioritizing based on how quickly you can realize them. An energy project that pays back in 18 months is very different from one that takes five years.
Clarient Group uses an ROI matrix that plots use cases based on two factors: how tangible the benefits are and how quickly you can measure them.
Easy to monetize: Benefits tied to energy, utility, or service contract savings. Example: adjusting cleaning schedules based on occupancy data delivers immediate savings from reduced service hours.
Medium difficulty: Benefits tied to time savings or data that requires work to access. Example: using fault detection to reduce work order tickets requires tracking volumes and resolution times.
Hard to monetize: Intangible benefits with long timelines. Example: improved occupant satisfaction from better HVAC control. Research shows occupancy-based HVAC control can achieve 17-24% energy savings while maintaining comfort, but measuring satisfaction takes time.
The matrix forces you to start with what you can prove today:
Short-term: Adjust cleaning schedules using occupancy data for immediate operational savings.
Medium-term: Optimize HVAC scheduling with occupancy sensors and BAS integration for annualized energy cost reduction.
Long-term: Integrate mobile credentials with building access control to enable automation of lighting, HVAC, and equipment based on building access patterns.
Short-term wins fund the long-term roadmap by proving you can execute and measure results.
Step Four: Test, Measure, Adapt
The framework is iterative. Test use cases, measure what happens, and adapt based on what the data tells you.
"Test in the desert and keep the feedback flowing," Dalton said.
Not every project works as intended. Sometimes the sensors aren't accurate enough. Sometimes the integration is more complicated than expected. Sometimes user behavior doesn't match your assumptions. Catch these issues early and adapt.
Research on occupancy-based HVAC controls has found that sensor accuracy directly impacts both energy savings and thermal comfort. If your occupancy sensors report a space as occupied when it's not, your HVAC system will make the wrong decisions.
Each project should feed data back into the system to refine what you do next. If a pilot in Building A delivers better results than Building B, figure out why. Use that information to improve the next rollout.
Lessons Learned: Honest Data Beats Optimistic Promises
Dalton kept coming back to the importance of "reading the sands"—being honest about what's actually happening, and a subtle reference to the conference’s Dune theme.
"Be open and honest—read the sands. Feedback from users, sites, and raw data tells you where the value is," he said.
The culture shift from exploring new possibilities to measuring real performance is hard. Solutions promise results. Projections look optimistic. Your executive team wants to hear that the investment is paying off. But if the data doesn't support it, you need to say so.
The owners who succeed at energy management create a culture where it's okay to report problems early. They track what's working and what isn't. They kill projects that aren't delivering value. And they double down on the initiatives that prove themselves with data.
This builds trust with executives. When you're honest about what's not working, they're more likely to support future proposals based on reported successes.
Making It Work: Tools for Prioritization
Clarient Group uses specific tools to help owners prioritize and track progress:
Early-stage decision matrix: Evaluate use cases against criteria like desirability, user impact, friction reduction, cost, complexity, and system readiness.
ROI framework combined with Eisenhower matrix: Overlay benefit timeline (short vs. long) with benefit type (tangible vs. intangible) to create a priority grid.
Monetizable actions tracker: Build a detailed breakdown showing the specific action, the KPI you'll track, how you'll measure it, and what data sources you need.
This level of detail makes it possible to calculate ROI rather than estimate it.
From Framework to Practice: The Occupancy-Driven Cleaning Example
To see how this works in practice, consider one use case Clarient Group prioritized: using occupancy data to optimize cleaning contracts.
The problem was clear. Commercial buildings typically clean all spaces on fixed schedules—daily, or every other day, or weekly. But occupancy varies dramatically by space and by time. Conference rooms might be heavily used on Tuesdays and Wednesdays but empty the rest of the week. Offices for staff who work remotely most of the time sit unoccupied. Break rooms in one wing see steady traffic while break rooms in another wing barely get used.
Cleaning on a fixed schedule means you're paying to clean spaces that don't need it while potentially under-cleaning the spaces that do.
The use case: integrate occupancy sensor data with cleaning operations. Identify spaces with consistently low utilization and reduce cleaning frequency. Redirect those cleaning hours to high-traffic areas that need more attention.
The benefits breakdown:
Tangible: Reduced service contract costs. OpEx savings from cleaning less frequently in low-use areas. These are quantifiable—compare your contract costs before and after adjusting schedules.
Intangible (but measurable): Improved cleanliness in high-traffic areas because you've redirected resources. Better space utilization data that helps with future decisions about which spaces to keep and which to repurpose.
Timeline: Short. You can pull your current cleaning contract, overlay occupancy data for the past few months, propose schedule changes, and measure cost impacts within a quarter.
The data sources required: occupancy sensors (which Clarient Group’s client already had from previous pilots), cleaning contracts (readily available), and feedback mechanisms to catch any complaints about cleanliness (survey tenants or track facility tickets).
The ROI calculation: straightforward. If you're spending $50,000 annually on cleaning and you reduce frequency in 20% of your spaces, you save $10,000 per year. If your occupancy sensors are already installed, the cost to implement this change is primarily staff time to analyze the data and renegotiate contracts.
This wasn't the use case anyone expected to prioritize. It wasn't about advanced HVAC optimization or predictive maintenance. But it delivered measurable results quickly, which built confidence in the broader program. And that confidence led to funding for more complex use cases down the line.
Conclusion: Building the Owner's Path to High-ROI Energy Management
The smartest buildings are the ones where energy data turns into action—where pilots become programs, where use cases get measured honestly, and where ROI gets proven rather than promised.
Clarient Group's framework provides a repeatable playbook:
Define your energy use cases by stripping away marketing language. Evaluate desirability and feasibility against your actual systems. Quantify both tangible and intangible ROI. Prioritize by payback timeline. Measure continuously and adapt.
Building Owner Takeaway
Stop collecting pilots, start building programs. Map isolated initiatives against common use cases. Create a program guide that explains how the pieces fit together.
Prioritize what you can measure today. Start with use cases where you have enough information to calculate savings and prove impact.
Create a culture of honest feedback. Make it safe for facility teams to report when things aren't working. The projects you kill based on real data are just as valuable as the ones you scale.
Think beyond energy bills. The 3-30-300 rule reminds us that utilities are the smallest cost in most buildings. Prioritize use cases that save energy while improving operations or occupant experience.
Use simple tools to drive decisions. A decision matrix and an ROI framework—even in a spreadsheet—can organize your thinking and help you focus resources on what matters.
As Dalton put it: "The point isn't a perfect calc—it's keeping your light green."
That means delivering enough measurable results to maintain executive support while building toward more ambitious goals.


This is a great piece!
I agree.